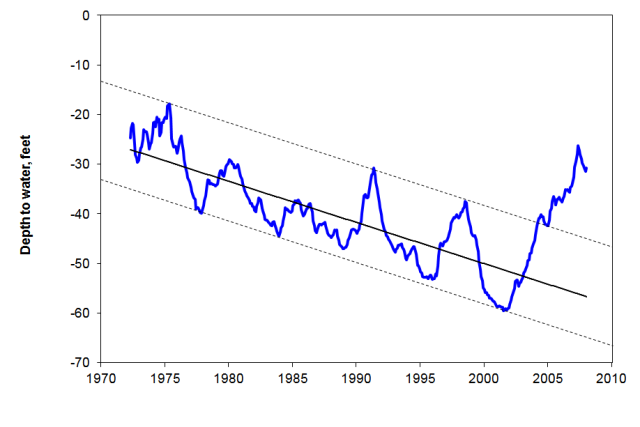
Rainfall and temperature records for Cincinnati from surface observatories, such as the Abbe Observatory on Lafayette Circle in Clifton, show a long-term rising trend with wet and dry cycles about 6 years each. These records, however, are inherently noisy, and a cleaner record can be found from the study of groundwater levels in shallow aquifers. An example is the Shaker Creek aquifer, near Mason OH, which has had continuous monitoring of water levels since 1972:

Note the long-term drawdown, caused by overpumping. on which is superimposed a set of oscillations with a period of about 5-6 years. Note also the recovery of the aquifer in 2008. It was at this point that Mason closed its well field and converted to Cincinnati-supplied water. Detrending the groundwater data and adding rainfall records for comparison shows how these cycles are related to rainfall, with a lag

of 2-3 months. A time series analysis of this pattern, using the program PAST, reveals periods of 4.5, 6.4, 7.9, and 10.6 years for these cycles. El Nino -- Southern Oscillation intensities have periods of 4.9, 5.6, 6.4, 8.9. and 11.6 years. It appears likely that the 4.9 and 6.4 year cycles in the groundwater levels are a response to ENSO events, but that other events also have considerable influence over rainfall patterns.
Cincinnati weather station records,
ENSO events and Cincinnati weather