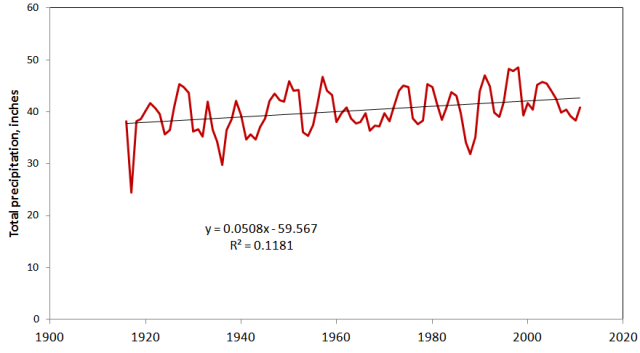
Weather data for Cincinnati in the period 1916 to 2010 show wet and dry cycles of about 6 years duration each. These might be related to the Pacific Ocean weather pattern known as El Nino -- Southern Oscillation (ENSO). Cincinnati data include direct measurement of rain and snow amounts as well as indirect measurements from groundwater levels.

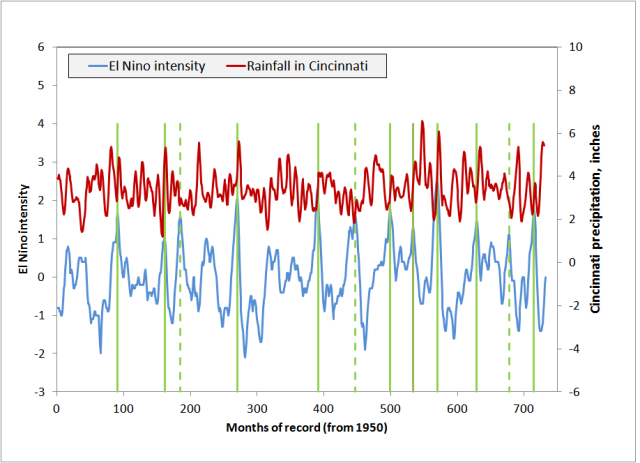
Comparison of the direct precipitation readings with ENSO intensities reveals that most major ENSO events (those with an ONI score greater than 1.0) are followed with a short lag by major increases in precipitation in Cincinnati.

Three of twelve events are not followed by rain spikes in Cincinnati and each of these occurred in fall rather than winter. Note, however, that 8 major rain episodes in Cincinnati were not preceded by ENSO episodes compared to 9 that were. Thus there must be other major influences on Cincinnati weather cycles.
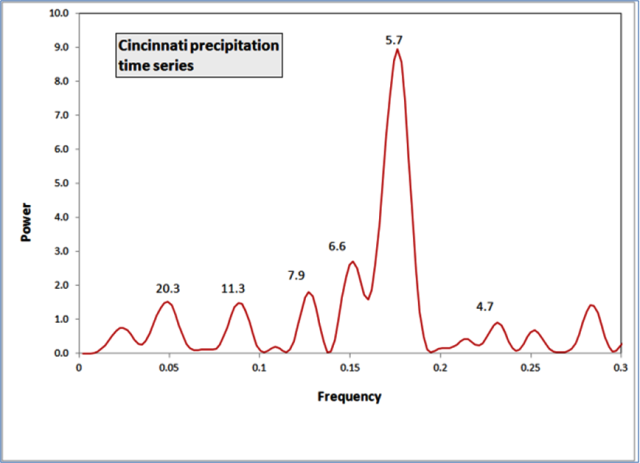
A time series analysis of the Cincinnati pattern, using the program PAST, reveals cycles with periods of 4.7, 5.7 and 6.6 years for these cycles, with the 5.7 year period the strongest.

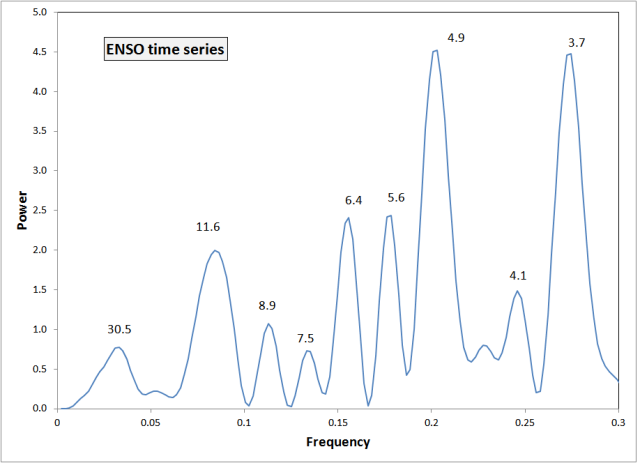
The comparable plot for ENSO shows many of the same periods.

Cinti precipitation |
ENSO events |
Tree rings (1885-2005) |
|||
|---|---|---|---|---|---|
Period |
Power |
Period |
Power |
Period |
Power |
3.5 |
1.42 |
3.7 |
4.46 |
3.6 |
0.05 |
4.0 |
0.69 |
4.1 |
1.49 |
4.3 |
0.78 |
4.7 |
0.43 |
4.9 |
4.52 |
5.1 |
0.72 |
5.7 |
8.94 |
5.6 |
2.43 |
6.1 |
1.59 |
6.6 |
2.70 |
6.4 |
2.41 |
6.6 |
1.21 |
7.9 |
1.81 |
7.5 |
0.73 |
7.3 |
1.48 |
9.2 |
0.20 |
8.9 |
1.07 |
8.3 |
2.03 |
11.3 |
1.49 |
11.6 |
1.97 |
12.0 |
2.56 |
20.3 |
1.53 |
18.7 |
8.44 |
||
30.5 |
0.78 |
38.2 |
14.71 |
||
It appears likely that ENSO events have considerable influence over rainfall patterns in the Ohio Valley, but that other controls are also important. Also the 5.7 year cycle is by far the strongest and could possibly used in interpreting climate proxies.