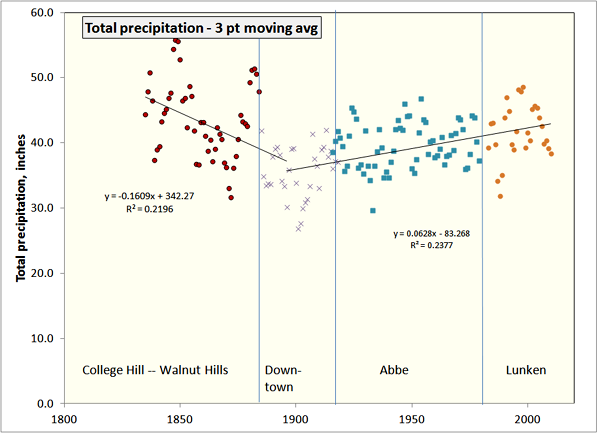
Rainfall and temperature records for Cincinnati in the period 1916 to 1982 were made at the Abbe Observatory on Lafayette Circle in Clifton. Later data are available for several stations. Those from Lunken airport are used here. Earlier annual data taken from downtown, Walnut Hills and College Hill are available in
Devereaux 1919, "Weather for Cincinnati Ohio for 130 years" [pdf format].
Temperature values show a steep increase that continued until about 1910 or 1920, followed by a much slower increase. The early increase is likely a reflection of the creation of an expanding "heat island" effect through industrialization of Cincinnati and an expansion of development onto the surrounding hillsides. The subsequent slower warming may also be a local effect or could be from global warming.

Because of the effect of elevation on temperature, all data have been converted to "Abbe equivalent" values. This is done by adjusting the values in each segment so that the average of the last 5 years of each segment is the same as the first 5 years in the subsequent segment. [excel file with original and adjusted data]
The pattern for precipitation is different. First, the stations do not differ. Second there is a change in behavior in the 1890-1900 time frame from wetter and highly variable to drier with lower variability. These are more likely continent-wide or global effects than the local effects suggested for the temperature pattern.

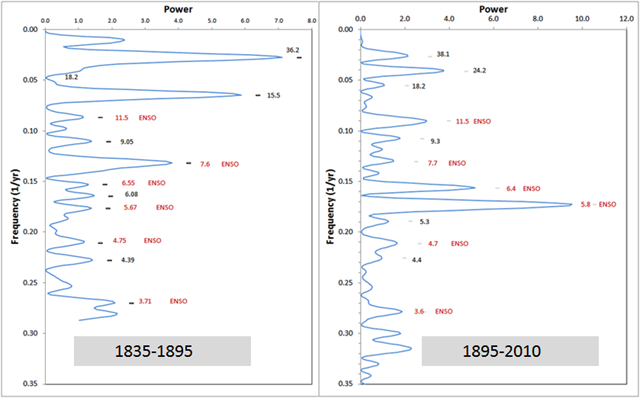
A time series analysis of these two segments, using the program PAST, reveals several cycles with periods that correspond to cycles in El Nino -- Southern Oscillation intensities, but at different powers. Note that the 7.6 year period dominates in the older record, whereas the 5.8 and 6.4 dominate in the younger record. It appears likely that ENSO events have considerable influence over rainfall patterns in the Ohio Valley, but this influence has changed with time and that other controls are also important. See El Nino and Cincinnati Weather.

| 1835-1895 | 1895-2010 | 1950-2010 El Nino events | ||||||
|---|---|---|---|---|---|---|---|---|
| Frequency | Multitaper | period | Frequency | Multitaper | period | Frequency | Multitaper | period |
| 0.033 | 5.13 | 30.0 | 0.026 | 2.83 | 37.8 | 0.033 | 0.78 | 30.5 |
| 0.037 | 1.52 | 27.0 | ||||||
| 0.060 | 4.78 | 18.0 | 0.046 | 1.26 | 22.0 | |||
| 0.090 | 1.77 | 11.2 | 0.094 | 2.30 | 10.6 | 0.086 | 1.97 | 11.6 |
| 0.108 | 1.27 | 9.20 | 0.104 | 1.02 | 9.63 | 0.113 | 1.07 | 8.9 |
| 0.121 | 1.40 | 8.28 | ||||||
| 0.127 | 1.79 | 7.87 | 0.130 | 1.45 | 7.67 | 0.133 | 0.73 | 7.5 |
| 0.141 | 1.72 | 7.10 | ||||||
| 0.163 | 1.45 | 6.15 | 0.154 | 4.28 | 6.51 | 0.156 | 2.41 | 6.4 |
| 0.179 | 1.33 | 5.58 | 0.174 | 8.13 | 5.76 | 0.178 | 2.43 | 5.6 |
| 0.193 | 1.47 | 5.19 | ||||||
| 0.213 | 0.33 | 4.71 | 0.208 | 2.43 | 4.82 | 0.203 | 4.52 | 4.9 |
| 0.231 | 0.78 | 4.32 | 0.225 | 2.66 | 4.45 | |||
| 0.279 | 3.74 | 3.58 | 0.276 | 1.80 | 3.62 | 0.246 | 4.46 | 3.7 |
Related webpages
Rainfall history from groundwater levels