Many attempts have been made to develop formulas that relate water quality parameters to the potential for corrosion of metals. None has been satisfactory in making accurate quantitative predictions of corrosion rates in water distribution systems, but some do have a role in qualitative prediction.
Reaction Rates - Some General Remarks
"Thermodynamics is easy. It's kinetics that's hard."
The direction and extent of chemical reactions is elegantly explained by thermodynamics, but this well-developed body of knowledge does little to explain the rates at which those reactions proceed. It is very common to assume that the rate will be proportional to the amount of one of the reactants. That is, that the reaction is "1st order," where the reaction follows the form of dC/dt = kC. Only radioactive decay seems to faithfully follow this model. Most corrosion reactions, over some part of the range of conditions, are governed by transport rather than by chemical reaction. That is, it is diffusion from the surface of the scale into the bulk water that controls the reaction rate. In this case, dC/dt = kt1/2 . If the rate is controlled by chemical interactions, these are likely to be surface reactions related to dislocations in the dissolving crystal. At different stages of the reaction progress, different mechanisms will apply and therefore different rate relationships will be observed.
What to do? For the most part, we do not have detailed mechanistic explanations for dissolution rates of scale minerals. A partial exception is calcite (CaCO3) - see for example Naviaux et al. (2019). Although not a substance of regulatory concern, calcite is widespread in distribution systems and might be useful as a proxy for lead and copper carbonates. (See Ca and Pb carbonates compared)
Most kinetic processes have some dependence on the amount of departure of the system from equilibrium, so indices of corrosion potential often incorporate a measure of disequilibrium. How can we express departure from equilibrium in a practical way for water distribution systems?
The Langelier Index
A time-honored formulation used by many water utilities is the Langelier Index. The idea is simple
LI = pHmeasured - pHequilibrium
but its implementation requires empirical corrections for ionic strength and temperature. Strictly speaking, it only applies to calcite (CaCO3), but it was widely used based on the notion that CaCO3 could provide a pervasive layer on pipe walls that would act to "passivate" the pipe metal. Most iron scales are too porous for this process to be effective, but it is common to see Pb or Cu carbonates forming such passivating layers, and it can be argued that the Langelier Index is a proxy for these compounds.
The Saturation Index
A more rigorous approach is to use the Saturation Index, which has temperature and ionic strength corrections built in and is formulated for each specific scale component. It is usually framed in logarithmic form (as is the Langelier Index):
SI = Log10(IAP/K)
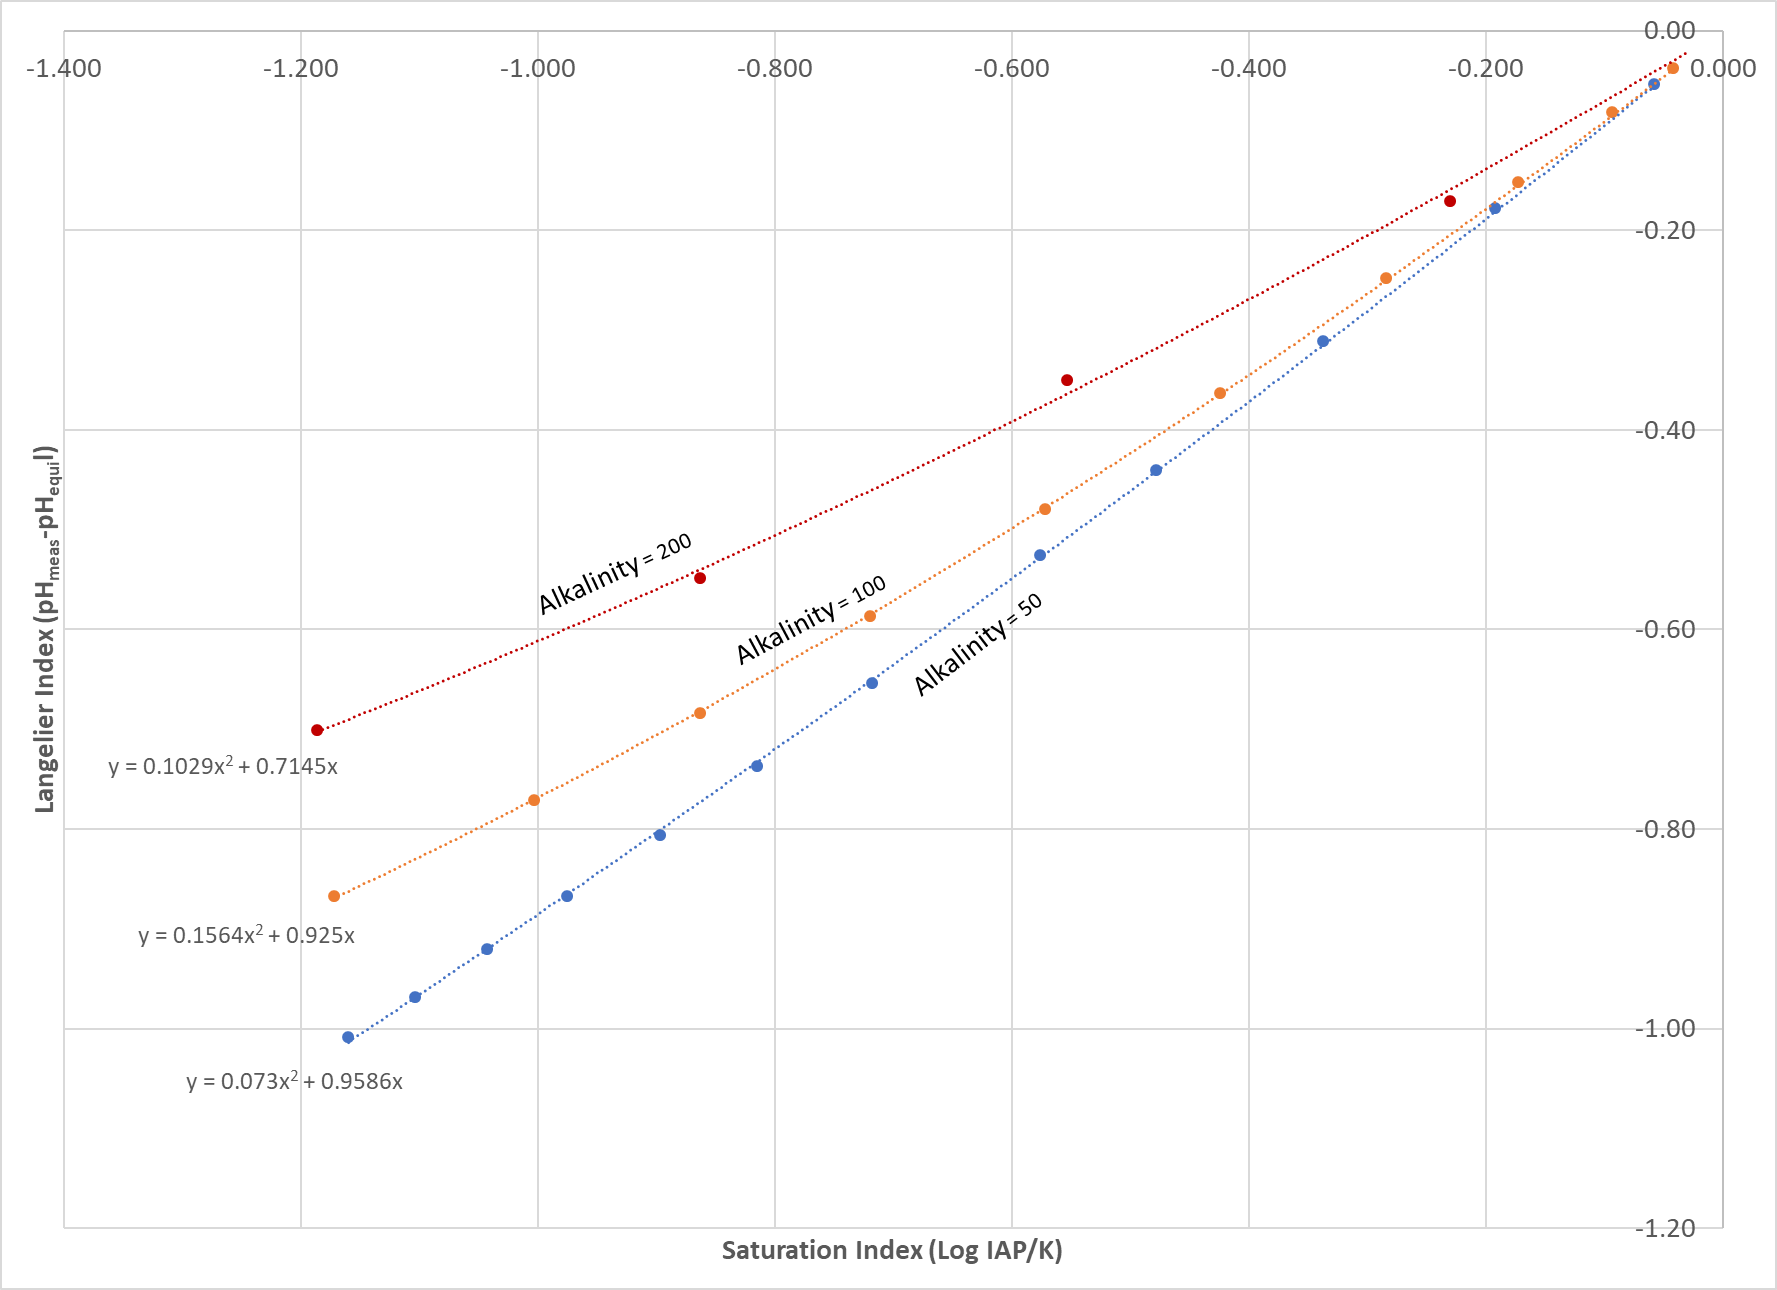
where K is the equilibrium constant (in this case the solubility product) and IAP is the ion-activity product, which has the same algebraic form as the equilibrium constant but with measured values. The parallel to the Langelier Index is obvious. For calcite, the two measures are directly related, but alkalinity must also be factored in:
For other carbonate minerals in distribution systems see The Saturation Index for Carbonates.
Anion Ratios
A different approach to corrosion potential is embodied in formulations based on ratios of anions. A widely-used index for iron and steel corrosion is the Larson-Skold Index:
LSI = ([HCO3-]+[CO32-])/([Cl-]+[SO42-] where [i] indicates equivalents/liter of component i.
A related index is the Chloride/Sulfate Mass Ratio or CSMR:
CSMR = (Cl- mg/L)/(SO42- mg/L)
Note that these two indices both contain chloride and sulfate, but in contrasting algebraic forms. Thus we would not normally expect a good correlation between them. Below is a cross-plot of these two indices for a set of twenty intermediate to large water distribution systems from the US.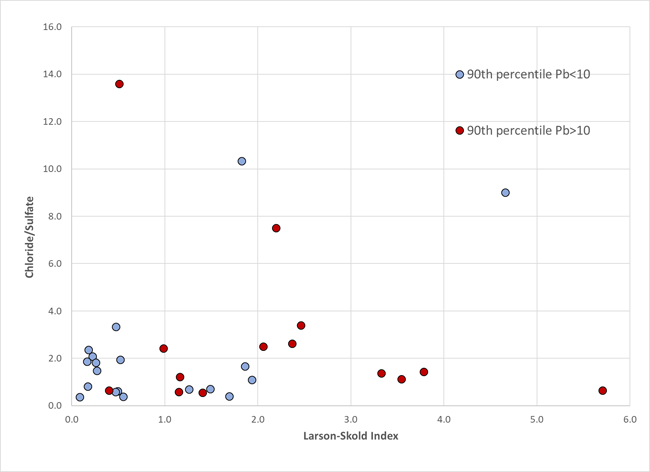
Note there is no correlation between the two indices, nor is the CSMR related to LCR results for Pb, but there is an associagtion of higher values of the Larson-Skold index with action level excedences for Pb. Almost all sampling rounds with LSI > 2.0 are associated with 90th percentile Pb above the "trip-wire" threshold of 10 micrograms/liter. Four of 10 in the range 1.0 to 2.0 exceeded the warning level.